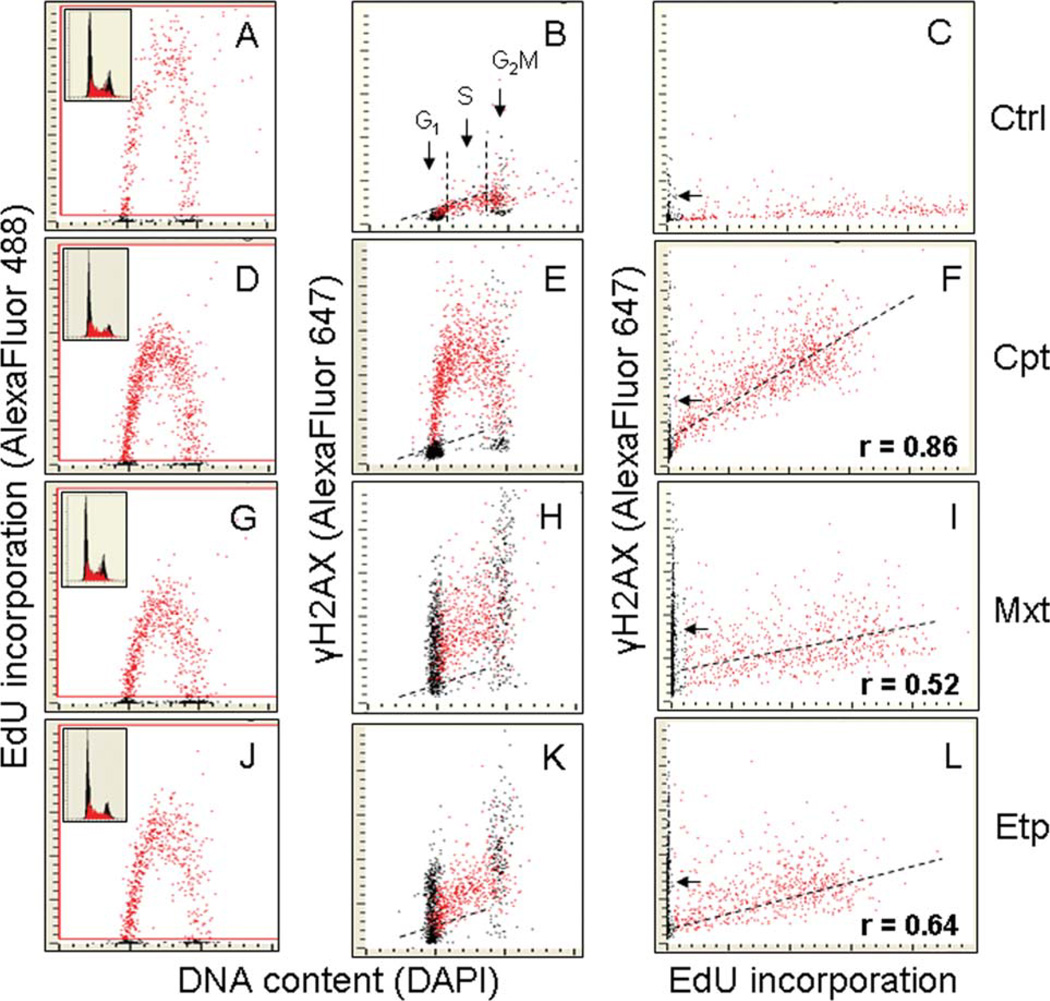
Figure 1.
Correlation between induction of γH2AX by Cpt, Mxt, and Etp and DNA replication in A549 cells. Exponentially growing A549 cells were exposed to 20 µM EdU for 30 min and then (still in the presence of EdU) were treated either with 0.2 µM Cpt (D, E, F), 0.2 µM Mxt (G, H, I), or 20 µM Etp (J, K, L) for 2 h. Control cells (A—C) were exposed only to 20 µM EdU for 2.5 h. The cells were then fixed and their blue (DAPI), green (EdU), and red (γH2AX) fluorescence were measured by LSC. The cells that incorporated EdU were “paint-gated” and the data were plotted as bivariate distributions representing γH2AX versus DNA content (B, E, H, K) or γH2AX expression versus EdU incorporation (C, F, I, L). Note that Cpt induced γH2AX only in EdU incorporating cells. In contrast, in response to treatment with Mxt or Etp, H2AX was phosphorylated in both EdU incorporating and non-incorporating (G1 and G2M) cells. A correlation between EdU incorporation and induction of γH2AX by the Top inhibitors is shown in Panels F, I, and L; the correlation coefficient refers only to DNA replicating cells. Insets in A, D, G, and J panels present DNA content frequency histograms from the respective cultures, with EdU incorporating cells marked in red. The dashed skewed lines in B, E, H, and K show the upper threshold for 97% of G1 and S-phase cells expressing γH2AX in the untreated culture (Ctrl). [Color figure can be viewed in the online issue, which is available at wileyonlinelibrary.com.]

