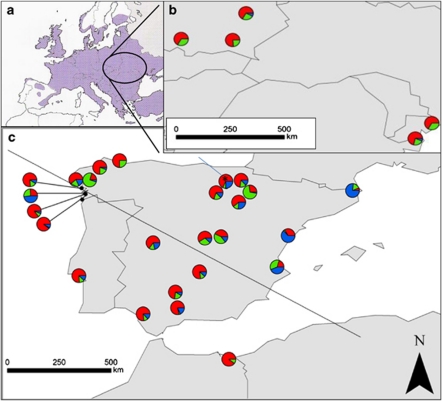
Figure 1.
Female morph frequencies (%) in populations of I. elegans and I. graellsii in Europe. The figure shows the range of I. elegans (map a; Dijkstra and Lewington, 2006), and the frequencies of the three female colour morphs, namely the androchrome (gray), infuscans (clear gray) and infuscans–obsoleta morph (black) at each population. The frequencies of the eastern European populations of I. elegans in the Ukraine and in Poland are shown in map b and of Iberian populations of I. elegans and I. graellsii in map c. The line across Iberia indicates the rough distribution of I. elegans and I. graellsii, with I. elegans being most frequent above the line and I. graellsii below the line. For details of each population, see Table 1. A full color version of this figure is available at the Heredity journal online.

