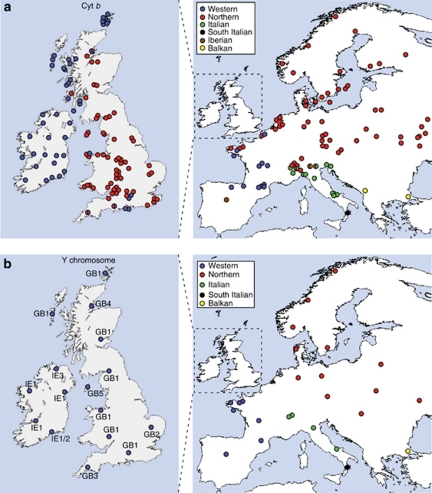
Figure 3.
Maps showing the distribution of cyt b (a) and Y-intron (b) lineages in the British Isles in the context of continental Europe, including published data (Mascheretti et al., 2003; Searle et al., 2009; McDevitt et al., 2010; Vega et al., 2010a, 2010b). All the Irish data and the British data for Y-introns are new; likewise for some British and continental European cyt b data (see Supplementary Table S1). For the Y-intron data, the haplotypes in the British Isles are labelled according to Supplementary Table S1 and Figure 4. Only a single individual per locality was typed for the Y-introns, except one locality in Ireland where the two individuals yielded different haplotypes.

