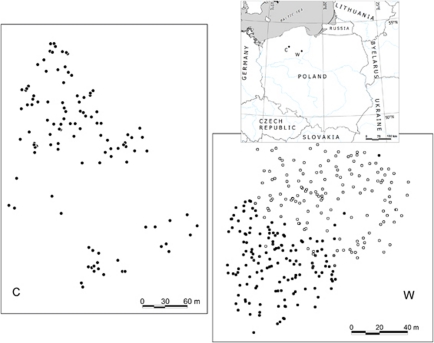
Figure 1.
Map of the location of the study populations, together with a within-plot distribution of sampled individuals: C, Czarne; W, Wierzchlas. For Wierzchlas, the dot shading reflects the probability of individual membership of one of two estimated sub-populations, according to a Bayesian clustering method applied to AFLP markers.

