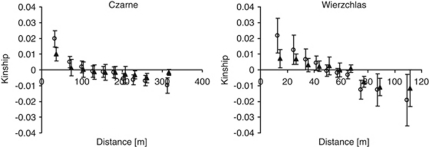
Figure 4.
Correlograms depicting the relationship between distance and kinship. AFLP-based correlograms are represented by the open circles and SSR-based correlograms are represented by the full triangles. Note that the correlograms for the two populations differ in spatial scale owing to sampling properties. The whiskers indicate 95% confidence intervals around the average kinship for a given distance interval.

