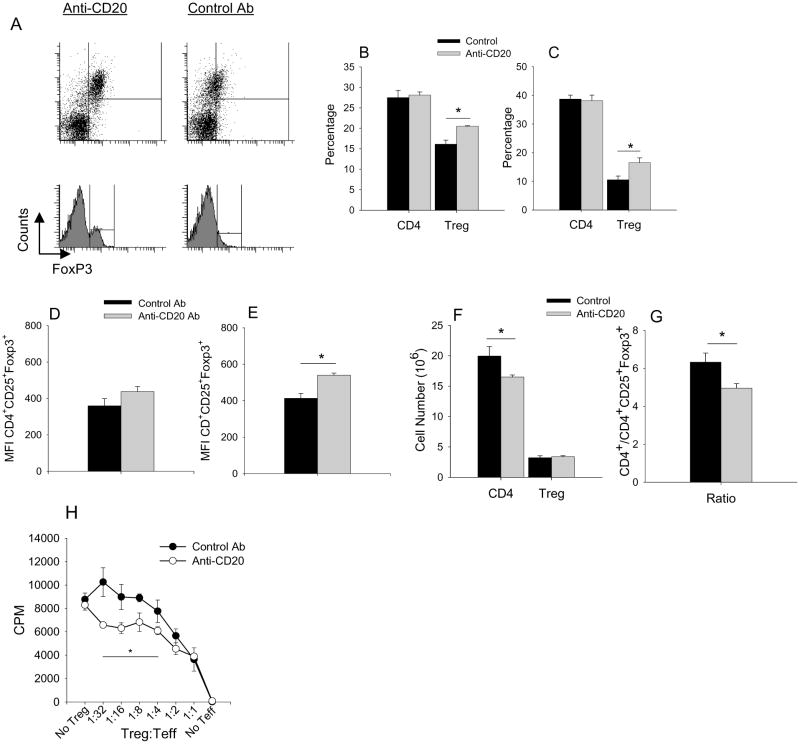
Figure 2. CD4+ CD25+ Treg cell number and function increase in B cell depleted mice.
A, Representative flow cytometry of Treg cells isolated from lymph nodes (B, D) and spleens (C, E) harvested after anti-CD20 mAb (n=5-6) or control Ab (n=5-6) treatment and analyzed by flow cytometry using anti-CD4, anti-Foxp3 and anti-CD25 fluorochrome labeled antibodies. Treg cells were measured as percentage of CD25+ Foxp3+ of CD4+ cells (B, C). Relative level of Foxp3 protein expression was determined by mean fluorescent intensities (MFI) of CD4+ CD25+ Foxp3+ cells (D, E). Cell number spleen (F) of CD4+ and CD4+CD25+ Foxp3+ from control and anti-CD20 treated mice. (G) Ratio of the cell number of CD4+ to CD4+CD25+Foxp3+. (H) CD4+CD25+ cells were isolated and pooled from spleens of 2 arthritic B cell-depleted (n=3 groups) or control Ab (n=3 groups) treated mice at 21 days or at peak of inflammation after Ab treatment. Purified CD4+ T cells (Teff) from untreated arthritic mice were co-cultured for 5 days with mitomycin-C treated naïve splenocytes, PG (10μg/ml) and titrated number of Treg cells. Proliferation of Teff cells was measured by 3H-thymidine incorporation. Values are mean ± SEM and are representative of 2-3 independent experiments. Asterisk (*) denote significant differences (P ≤ 0.05).

