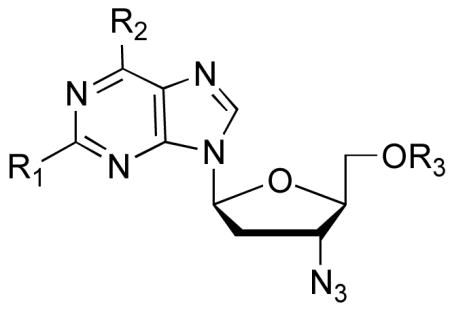
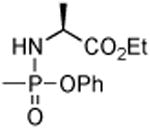
Table 2.
Cellular pharmacology of l-3′-azidopurine nucleosides.
 | |||||
|---|---|---|---|---|---|
| Cmpd | R1 | R2 | R3 | Cellular pharmacology in human PBM Cells | |
| Metabolites detected | Amount fmol/106 cells | ||||
| 7 | H | Cl | H | 7 | 7.8 |
|
| |||||
| 9 | H | OCH3 | H | None | BLDa |
|
| |||||
| 10 | H | NH2 | H | 10 | 4400 |
| 10-MP | 1400 | ||||
| 10-DP | 76 | ||||
| 10-TP | 670 | ||||
|
| |||||
| 11 | H | NH2 |

|
10 | 7500 |
| 10-MP | 4200 | ||||
| 10-DP | 1200 | ||||
| 10-TP | 7400 | ||||
|
| |||||
| 12 | H | NHCH3 | H | 12-MP | 17 |
|
| |||||
| 15 | NH2 | OH | H | 15 | 3200 |
| 15-MP | 46 | ||||
| 15-TP | 54 | ||||
|
| |||||
| 17 | NH2 | Cl | H | 17 | 7.6 |
| 17-DP | 38.3 | ||||
| 17-TP | BLD | ||||
|
| |||||
| 18 | NH2 | Cl |

|
18 | 12 |
| 17 | 49 | ||||
| 17-MP | 430 | ||||
| 17-DP | 190 | ||||
| 17-TP | 10 | ||||
|
| |||||
| 20 | NH2 | NH2 | H | 20-MP | 3.5 |
| 20-TP | 7.6 | ||||
BLD = below the limit of detection.
