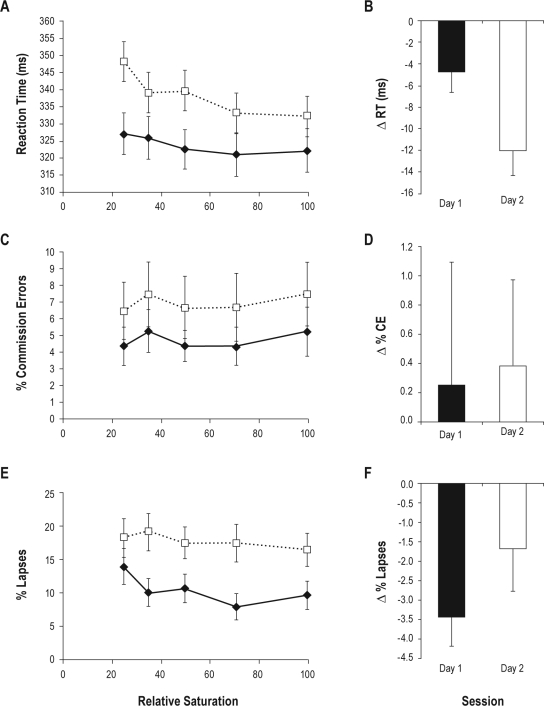
Figure 2.
Psychomotor vigilance task (PVT) task results for each of the 3 dependent variables. Panels A, C, and E plot the point-estimate cell means and standard errors for mean reaction time (RT), percent commission errors (%CE), and percent lapses (%Lapses), respectively, by degradation level for Day 1 (solid line) and Day 2 (dotted line). The main effect of Degradation is significant for RT (Panel A) and %Lapses (Panel E), and the main effect of Day is significant for all 3 variables. Panels B, D, and F present the least-square means and standard errors of the log-linear contrast (i.e., the change in the variable from high to low degradation, denoted by the symbol “▵”) from the ToT model, for mean RT, %CE, and %Lapses, respectively. This contrast is equivalent to the linear change in RT as a function of degradation ignoring the unequal spacing of independent variable values. The Day by Degradation (Day * Deg) interaction is significant only for RT (Panel B). Negative values indicate a reduction in the variable from high to low degradation.

