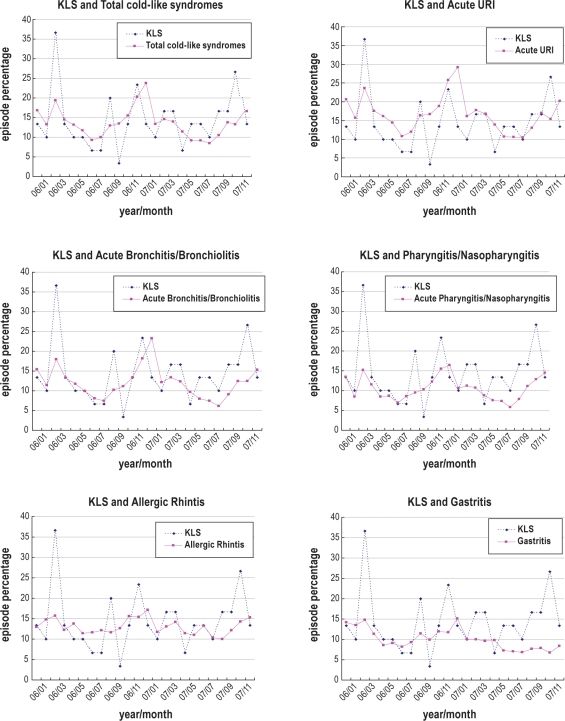
Figure 1.
Time series data of KLS and the various subdivisions of acute respiratory events. In order to compare KLS and the various subdivisions of acute respiratory events in terms of time lag trend in the chart, we weighted the percentage of acute URI by 10 times, acute bronchitis and bronchiolitis by 20, pharyngitis and nasopharyngitis by 100, allergic rhinitis by 50, and gastritis by 100.

