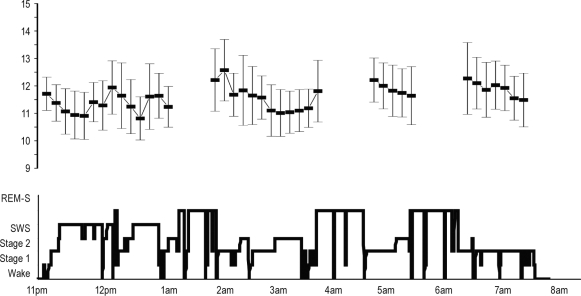
Figure 2.
Variation of spindle frequency along nighttime (Typical example from a recording site in the anterior lateral frontal cortex of patient 10). Bottom = Hypnogram. Top: each square represents the mean spindle frequency (± SD) during 8-min consecutive NREM sleep periods (for each period, approximately 50 spindles are analyzed). The variation between mean spindle frequency during the first and the fourth period of NREM is significant but weak (11.34 ± 0.24 vs 11.89 ± 0.37 ANOVA, P < 0.02). The variations of the mean frequency during the night are situated in the range of the slow spindles (between 10.8 Hz and 12.3 Hz), consistent with the spindle frequency recorded in the lateral frontal cortex.

