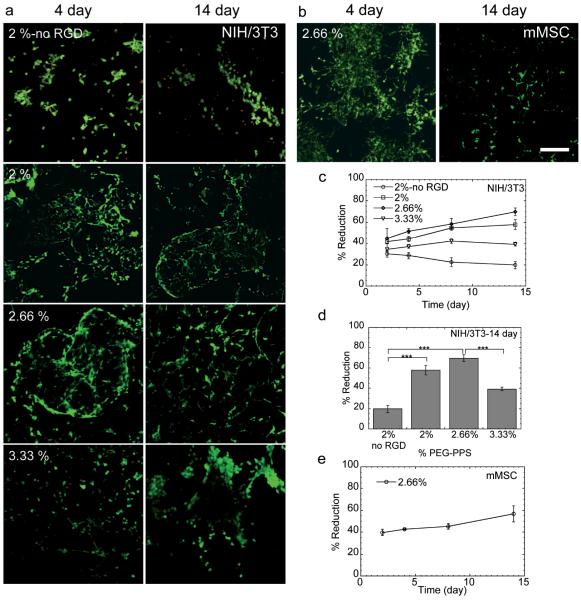
Figure 3.
(a) Live/Dead staining (green = live, red = dead) of NIH/3T3 cells in 2, 2.66 and 3.33% PEG-PPS hydrogels with and without PEG-PPS-RGD, and of (b) mMSCs in 2.66% PEG-PPS hydrogels with PEG-PPS-RGD is shown after culturing for 4 and 14 days. (c) Metabolic activity (% reduction) of NIH/3T3 cells in 2, 2.66 and 3.33% PEG-PPS hydrogels with and without PEG-PPS-RGD. Metabolic activities at 14 days are shown in (d). (e) Metabolic activity of mMSCs in 2.66% PEG-PPS hydrogels is shown over time. The symbol *** indicates a significant difference of p < 0.001 between various proliferation rates. Scale bar = 150μm.

