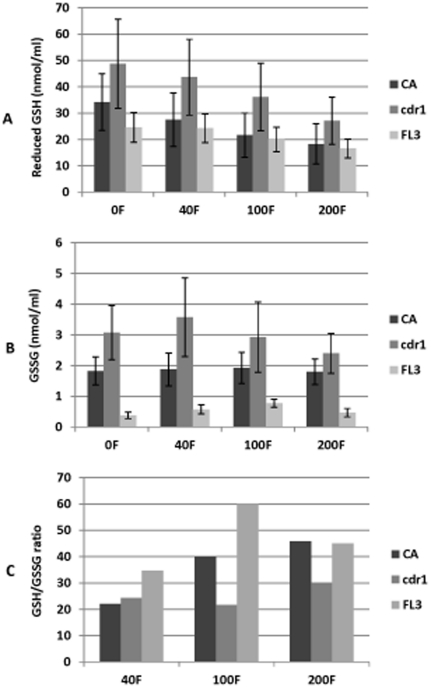
Figure 4. Effect of farnesol on intracellular GSH/GSSG homeostatis and redox balance.
Significant reduction in GSH levels proportional to farnesol concentration with FL3 exhibiting lowest levels and highest disruption in ratio whereas cdr1 had highest GSH levels with minimal changes in ratio noted. Error bars indicate the standard errors of the means.

