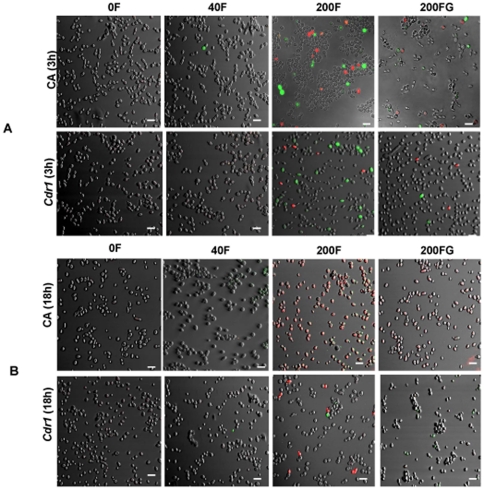
Figure 5. Representative confocal scanning laser fluorescent images of CA and cdr1 cells stained for ROS accumulation and necrosis following exposure to 40 and 200 µM farnesol in the absence (F) and presence (FG) of exogenous glutathione.
(A) Minimal green (ROS accumulation) and red (dead) fluorescence is seen in CA and cdr1 following 3 h exposure to farnesol whereas (B) the majority of CA cells were red following 18 h exposure with significant decrease in fluorescence seen upon exogenous glutathione supplementation). In contrast, minimal fluorescence was seen in cdr1 cells at 18 h. Bar represents 20 µm. p<0.05.

