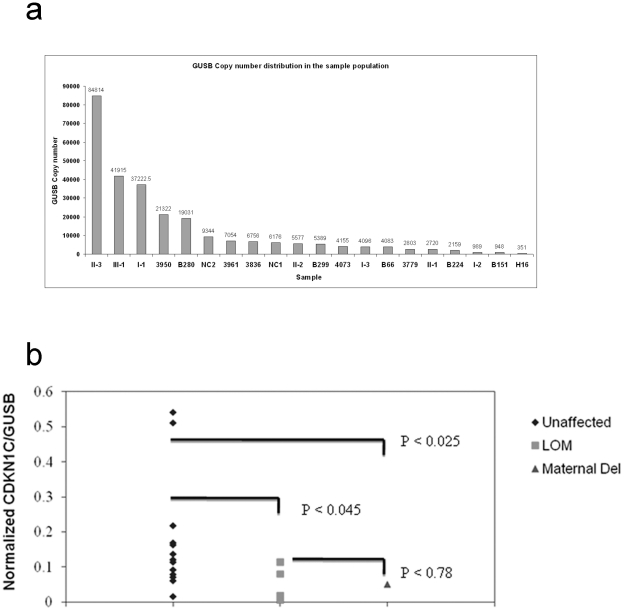
Figure 3. GUSB copy number distribution in the BWS and control population.
(a) GUSB expression values were obtained from a 50 ng equivalent of total RNA. Quantitative analysis of CDKN1C expression. (b) CDKN1C expression in the blood from 12 unaffected individuals (diamonds), five BWS cases with loss of methylation at IC2 and no deletion (squares), and individuals with deletion of the maternal IC2 (triangles). The Mann Whitney non-parametric U test was used to derive the P values shown. Statistically significant P values were obtained for the population differences in CDKN1C expression between unaffected controls and cases with loss of methylation and KCNQ1/IC2 deletion.

