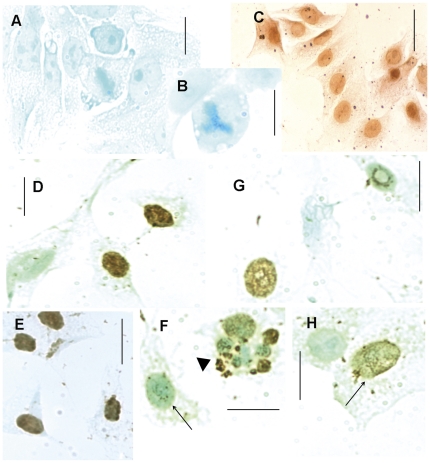
Figure 7. DNA fragmentation revealed in HeLa cells with the TUNEL assay.
A, B. Negative control; C. Positive control. D-F. TSA-treated cells (arrowhead, cell death preceded by multinucleation); G, H. VPA-treated cells. Positive response intensities: strong (D, E), moderate (G, H (arrow)), weak (F, arrow). Scale bars, 25 µm.

