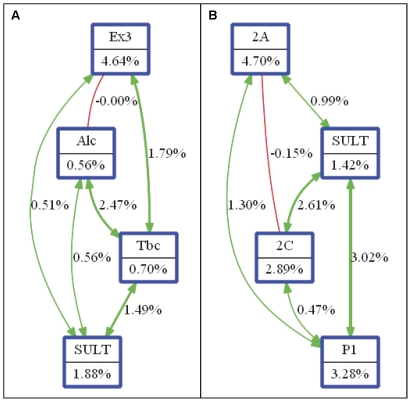
Figure 2. Interaction entropy graphs.
The interaction model describes the percentage of the entropy (information gain) removed by each variable (main effect: represented by nodes) and by each pairwise combination of attributes (interaction effect: represented by connections). Attributes are selected on the basis of MDR results obtained in case of (A) Smokers and (B) Non smokers. Labels: Ex3: EPHX1 Tyr113His, Alc: alcohol consumption, Tbc: Tobacco chewing, SULT: SULT1A1 Arg213His, 2A: CYP1A1*2A, 2C: CYP1A1*2C, P1: GSTP1 Ile105Val.

