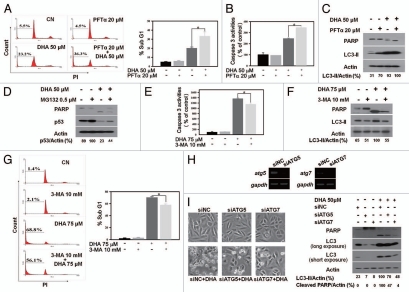
Figure 5.
Autophagy enhances DHA-induced apoptosis and inhibition of autophagy partially prevents DHA-induced apoptotic cell death. (A–C) Induction of autophagy by PFTα enhances DHA-induced apoptosis. SiHa cells were incubated for 2 h with or without 20 µM PFTα before incubation for 24 h with 50 µM DHA. The percentage of cells in the Sub G1 phase (A) and caspase-3 activity (B) were measured as described in the Materials and Methods section. Each bar represents the mean of more than four determinations repeated in three separate experiments. *p < 0.05. The levels of PARP, LC3 and actin were assessed by protein gel blotting (C). (D) Inhibition of autophagy by MG132 attenuates DHA-induced apoptosis. SiHa cells were incubated for 1 h with or without 0.5 µM MG132 before incubation for 24 h with 50 µM DHA. The levels of PARP, p53 and actin were assessed by protein gel blotting. (E–G) Inhibition of autophagy by 3-MA prevents DHA-induced apoptosis. SiHa cells were pretreated with 10 mM 3-MA for 1 h and then incubated with 75 µM DHA for 5 h. Caspase-3 activity (E) and the percentage of Sub G1 fraction (G) were analyzed as described in the Materials and Methods section. Each bar represents the mean of more than four determinations repeated in three separate experiments. *p < 0.05. The levels of PARP, LC3 and actin were assessed with a protein gel blot assay (F). (H) SiHa cells were seeded in six-well plates. After 24 h, the cells were treated with nontargeting control siRNA (siNC), ATG5 siRNA (siATG5) and ATG7 siRNA (siATG7). At 36 h after transfection, ATG5 and ATG7 mRNA expression levels were examined by RT-PCR analysis. The data shown are representative of three similar ones analyzed by agarose gel electrophoresis after RT-PCR. (I) SiHa cells were seeded in six-well plates. After 24 h, the cells were treated with siNC, siATG5 and siATG7. At 36 h after transfection, cells were treated for 24 h with 50 µM DHA. Light microscope images were captured (left) and cells were harvested and protein gel analysis was performed using the following antibodies: PARP, LC3 and actin as a loading control (right). The data shown are representative of two independent experiments with similar results.

