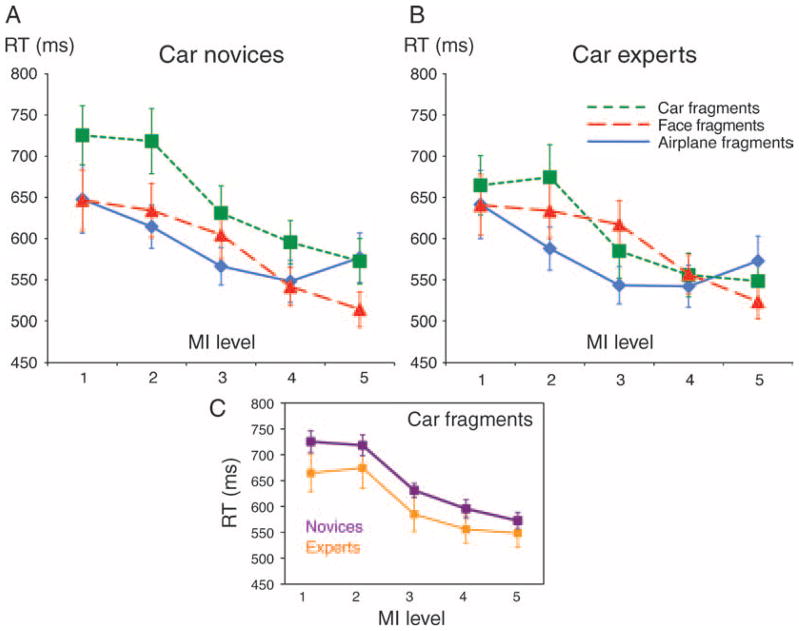
Figure 2.
Mean reaction times (RTs) of categorization of car, face, and airplane fragments (green, red, and blue lines, respectively) as a function of MI level for (A) novices and (B) car experts. MI levels are in ascending order, 1 representing the lowest level and 5 representing the highest level. Error bars indicate SEM. Note the similarity in shapes of the RT curves for the categorization of car fragments by car experts and novices, highlighted in (C).

