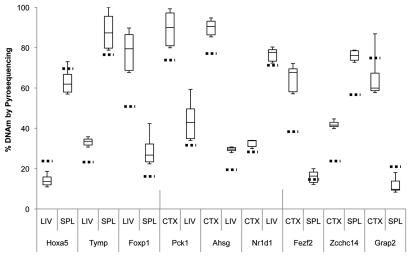
Figure 3.
Boxplot of pyrosequencing data obtained from liver (LIV), spleen (SPL) and cerebral cortex (CTX) tDMRs. We assessed and validated percent DNA methylation of three unique tDMRs from each pair of tissues compared by CHARM. For each tDMR, the number of CpGs assayed varied from 4 to 8 CpGs, thus a small subset of the region assayed by the CHARM array. Average percent methylation was determined from all of the assayed CpGs for each tDMR in each tissue type and displayed as a boxplot. Stippled horizontal lines represent the percent DNAm predicted by CHARM for the particular tissue for the entire tDMR region. Types of tissue being compared and the nearest genes associated with the tDMRs are indicated below the X-axis.

