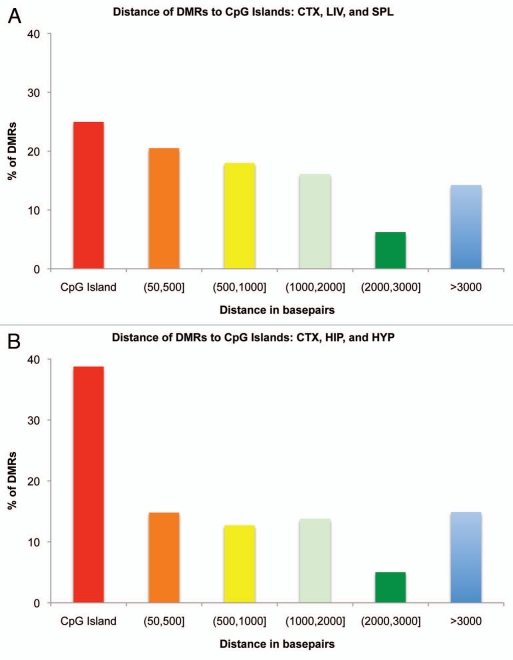
Figure 5.
Histogram of the distance of tDMRs and brDMRs to the nearest CpG island. (A) tDMRs annotated by CHARM in liver, spleen and cortex comparisons were tallied and their distance to the nearest CpG island calculated. Distances of DMRs to CpG islands were separated by different distance categories or bins and graphed as a percentage of the total DMRs analyzed. Red bar represents the percentage of DMRs that fall on a CpG island. Distances greater than 50 bp and less than or equal to 3,000 bp from a CpG island are collectively considered as “CpG shores.” (B) Similar analysis was performed for brDMRs annotated by CHARM in cortex, hippocampus and hypothalamus.

