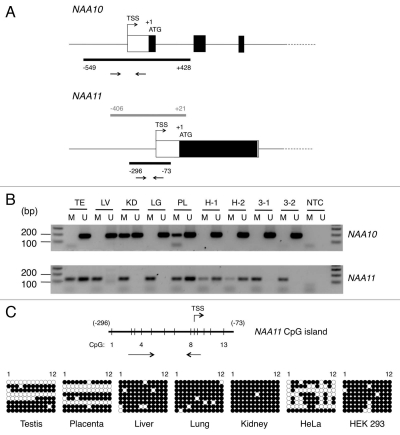
Figure 3.
Identification of CpG islands in proximal promoter regions of NAA10 and NAA11 genes and analysis of their methylation status. (A) Genomic organization of NAA10 and NAA11 genes at their 5′ ends. Black bars represent the locations of CpG islands in both genes. The arrow pairs denote the positions of primers used for MS-PCR. Grey bar refers to the genomic fragment cloned for NAA11 promoter assay. TSS, transcription start site. The genomic positions of CpG islands and NAA11 promoter fragment are annotated with respect to the start codon (ATG) of the respective gene, with A denoted as +1. (B) Analysis of methylation status of NAA10 and NAA11 gene proximal promoters in human tissues and cell lines by MS-PCR. Sizes of amplicons: for NAA10 gene: M primers (178 bp), U primers (183 bp); for NAA11 gene: M primers (129 bp), U primers (126 bp). Duplicate sets of genomic DNA samples from HeLa (H-1 and H-2) and HEK 293 (3-1 and 3-2) cells, which were harvested from the same preparations of cells for NAA10 and NAA11 expression analysis in Figure 1D, were examined. TE, testis; LV, liver; KD, kidney; LG, lung; PL, placenta; NTC, no-template control reaction. Forty cycles of amplification were performed. (C) Bisulfite sequencing analysis of the CpG island in NAA11 gene. Vertical lines on horizontal bar refer to the position of CpG dinucleotides (1–13) in the CpG island. Annotations are defined as in (A). Owing to the constraints in primer design, the 13th CpG dinucleotide was not analyzed in this experiment. For HeLa and HEK 293 cells, only one genomic DNA sample from each cell line was analyzed. Black circle, methylated CpG dinucleotide; white circle, non-methylated CpG dinucleotide.

