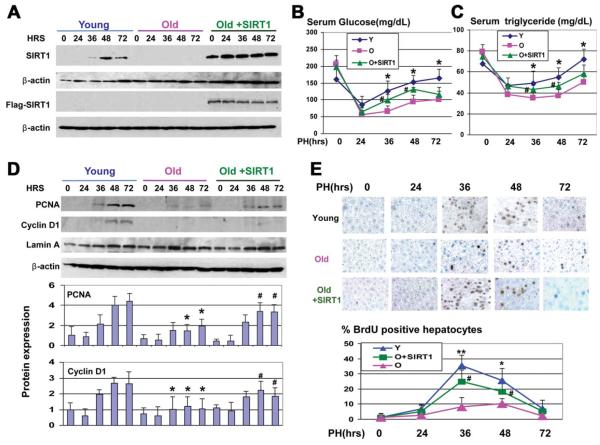
Fig. 6.
Ectopic expression of SIRT1 in the livers of old mice corrects glucose and TG levels. (A) Protein levels of SIRT1 and FLAG-SIRT1 in experimental animals. Western blotting was performed as described above. (B and C) Glucose and TG levels were determined in the blood of young and old mice and in the blood of old mice injected with FLAG-SIRT1. n = 3-4; *P < 0.05, young versus old; #P < 0.05, old+SIRT1 versus old. (D) Ectopic expression of SIRT1 leads to the activation of PCNA and cyclin D1 in livers of old mice. Western blotting was performed with nuclear extracts from old and old SIRT1-injected mice. Bottom image shows levels of PCNA and cyclin D1 as ratios to β-actin. n = 3-4; *P < 0.05, young versus old; #P < 0.05, old+SIRT1 versus old. (E) Ectopic expression of SIRT1 accelerates liver proliferation after PH. Upper panel shows BrdU staining of livers at different time points after PH. Bottom image shows percentage of BrdU-positive hepatocytes. n = 3-4; *P < 0.05, young versus old; #P < 0.05, old+SIRT1 versus old.

