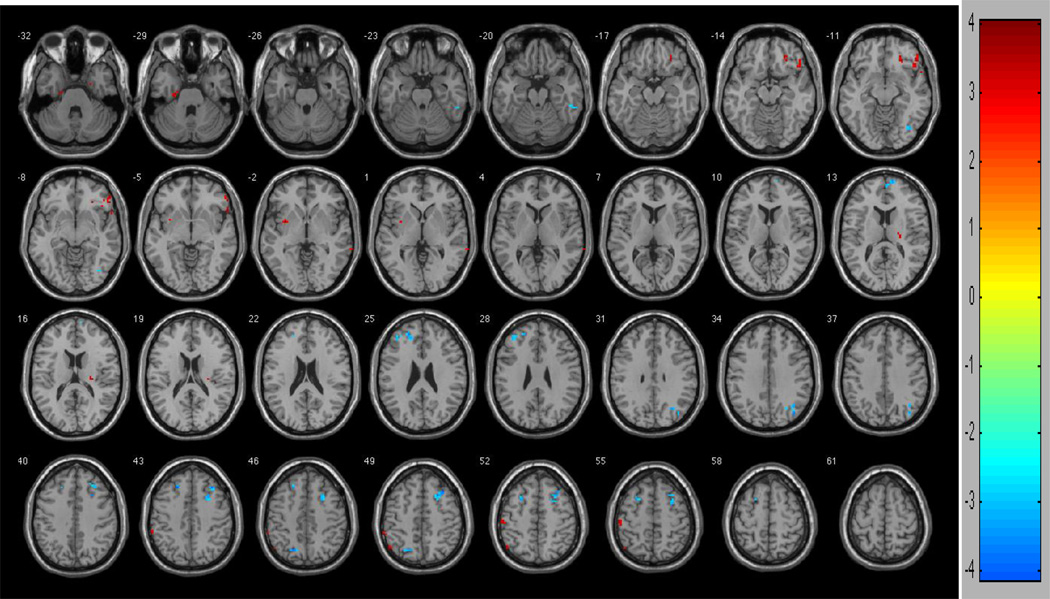
Figure 3.
Regions of contrast between participants low in risk aversion and high in risk aversion. Hot colors (reds) represent regions of difference such that high gamma (high risk aversion) are greater low high gamma (low risk aversion). Cool colors (blues) represent regions of difference such that low gamma (low risk aversion) are greater than high gamma (high risk aversion). To control for multiple comparisons and spurious findings, we utilized the following congruent with our False Discovery Rate (FDR) controlled within-group analyses: Cluster size > 5 voxels. p-value < 0.004.

