
Figure 2.
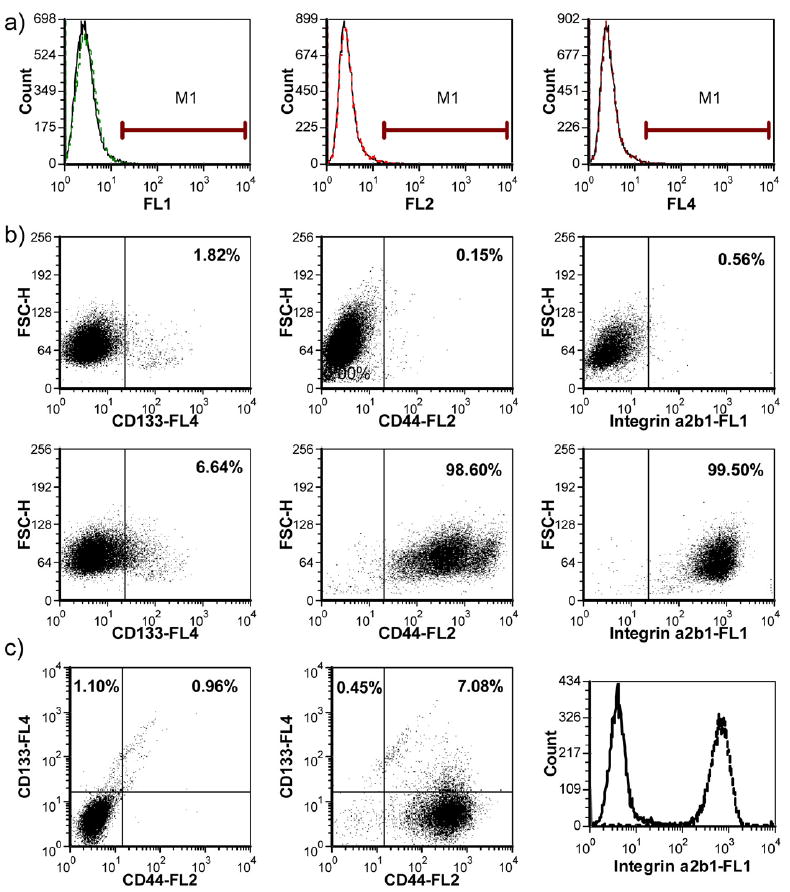
Characterization of cell surface marker expressions on RC-92a/hTERT cells. a) Isotype control profiles on all channels (dashed line: isotype; solid line: negative control without staining); b) single color staining of CD133, CD44 and integrin α2β1 (the upper panels show the negative control profiles; the lower panels show the stained samples); c) multicolor staining; the left profile shows the negative control; the middle profile shows the CD133 and CD44 double color trace; the right profile shows the integrin expression in CD133+/CD44+ cells (solid line: negative control; dotted line: integrin staining).