
Figure 8.
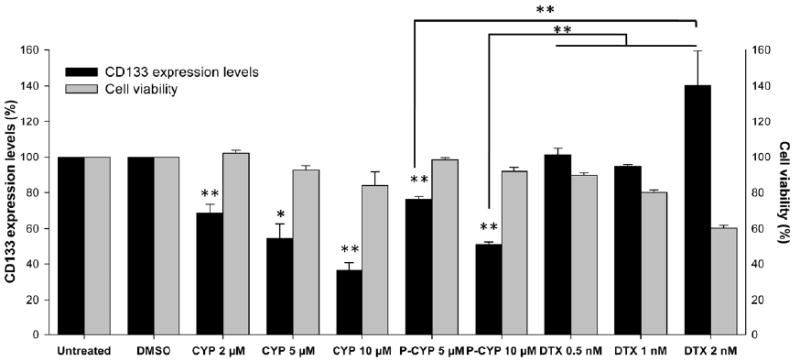
Summary of CD133 changes and cell viability. Black columns: CD133 expression level (%); gray columns: cell viability (%). The data are presented as mean±SD of the experiments done in triplicate. *, p<0.05; **, p<0.01. Free cyclopamine and docetaxel treatments were compared to DMSO treatment; HPMA copolymer-cyclopamine conjugate was compared to untreated group.