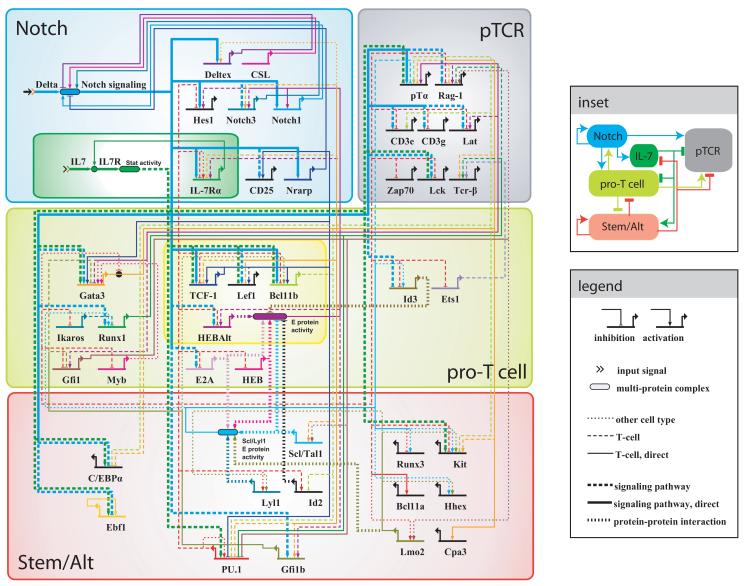
Figure 4.
Reconstruction of the T-Cell Developmental Gene Regulatory Network. Regulatory network encompasses Notch signaling (blue), IL-7 signaling (dark green), pre-TCR signaling (gray), T-cell regulatory genes (light green), and stem and alternate fate regulatory genes (red). T-cell regulatory genes sharply up-regulated prior to commitment are enclosed in a yellow box. Genes and connections active during the earlier T-cell developmental stages are placed to the left, whereas genes and connections active during later stages are placed to the right. The prevailing connections between the genes in different groups and their signs are summarized in the inset. An online version of this network is available at http://www.its.caltech.edu/~tcellgrn/.

