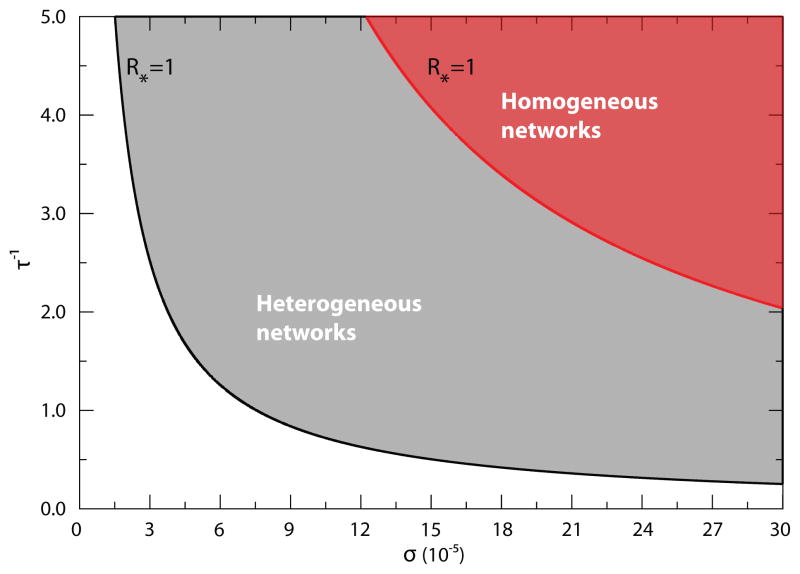
Figure 4.
Phase diagram on the σ-τ−1 plane for the case of Eq. (15) in heterogeneous and homogeneous subpopulation networks. The phase diagram separating the global invasion from the extinction regime is shown on the σ-τ−1 plane assuming Eq. (15) for commuting rates. The solid lines correspond to the solution R* = 1 of Eq. (16), above which the infection spreads at the metapopulation level as indicated by the shaded areas. The diagrams should be compared with Fig. 3.

