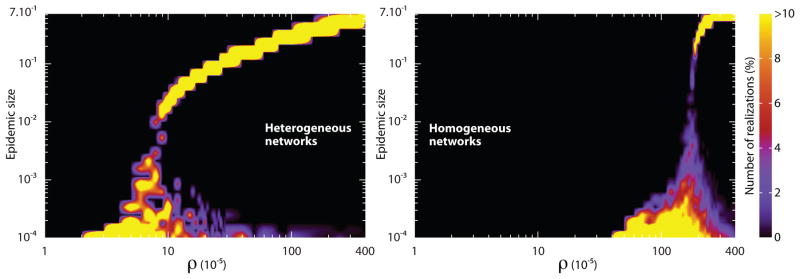
Figure 7.
Distribution of epidemic sizes in heterogeneous (left) and homogeneous (right) subpopulation networks as a function of ρ. Each color map shows the probability of observing a fraction of subpopulations affected by the outbreak as a function of commuting ratio. Each figure readily shows a critical point of ρ, below which most of the epidemics are confined to a few number of subpopulations. Above the critical point most of the realizations affect almost the entire set of subpopulations. In order to highlight the differences with respect to network topology, realizations resulting in epidemics confined to less than ten subpopulations have been excluded from the analysis of size distributions. The critical value of the commuting ratio differs more than one order of magnitude as we switch from a heavy-tailed to a Poisson degree distribution. Since the precise value of the return rate does not alter the results, we have set τ−1 = 1 day and changed σ in order to vary ρ. Both networks contain V = 105 subpopulations, each of which accommodates a degree dependent population of N̄k = N̄k/〈k〉 inhabitants with N̄ = 103. The disease is characterized by R0 = 1.5 and μ−1 = 5 day.

