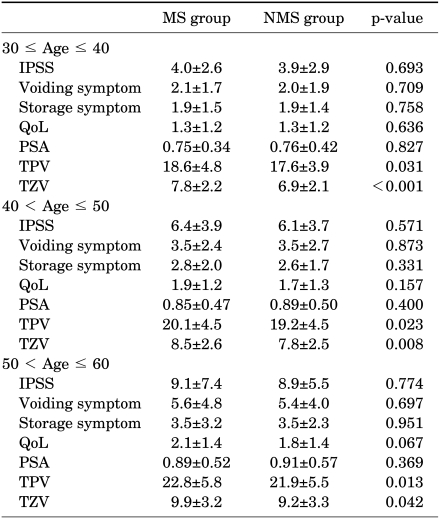
TABLE 3.
Comparison of the metabolic syndrome group and non-metabolic syndrome group according to age distribution
Satistical analysis by student's t-test, MS: metabolic syndrome, NMS: non-metabolic syndrome, IPSS: International Prostate Symptom Score, QoL: quality of life, PSA: prostate-specific antigen, TPV: total prostate volume, TZV: transitional zone volume, Statistical analysis by Student's t-test

