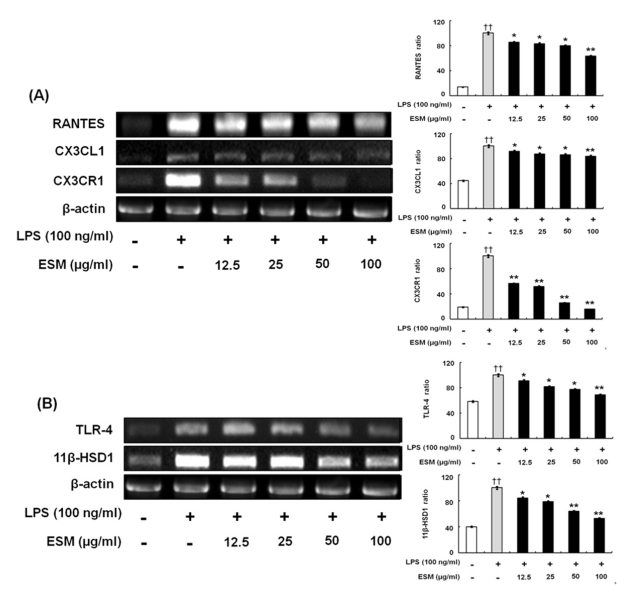
Figure 3.
ESM inhibited chemokine production in LPS-stimulated RAW 264.7 cells. RAW 264.7 cells were treated with various concentrations (12.5, 25, 50, 100 µg/ml) in the absence or presence of LPS (100 ng/ml) for 24h. Cell lysates were extracted, and protein levels of each chemokine were then analyzed by RT-PCR. Each value represents the mean±S.D. in triplicate. ††p<0.01 vs. cells only based on a Student's t-test. *p<0.05, **p<0.01 vs. LPS only based on a Student's t-test.

