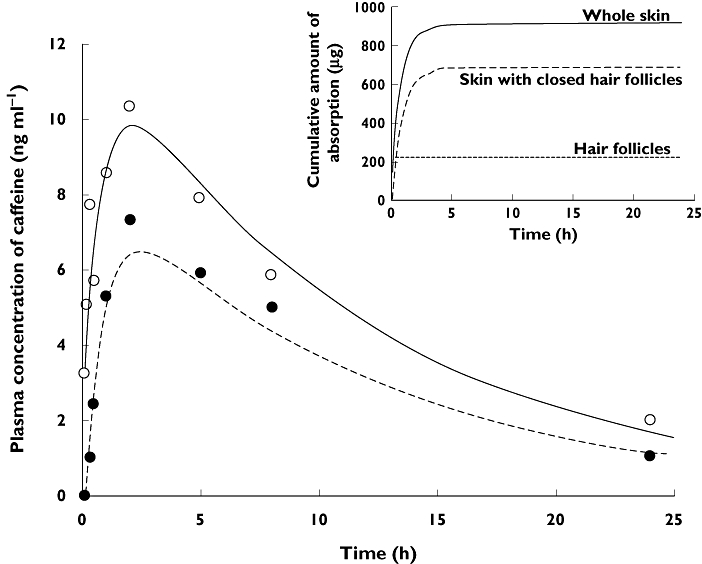
Figure 2.

Representative plasma concentration-time profile of caffeine and the model fitting curve (Subject 1) from the first order absorption model. (○) open hair follicles, (•) closed hair follicles. Lines represent the fitting curve. Insert is cumulative absorption profile for this subject
