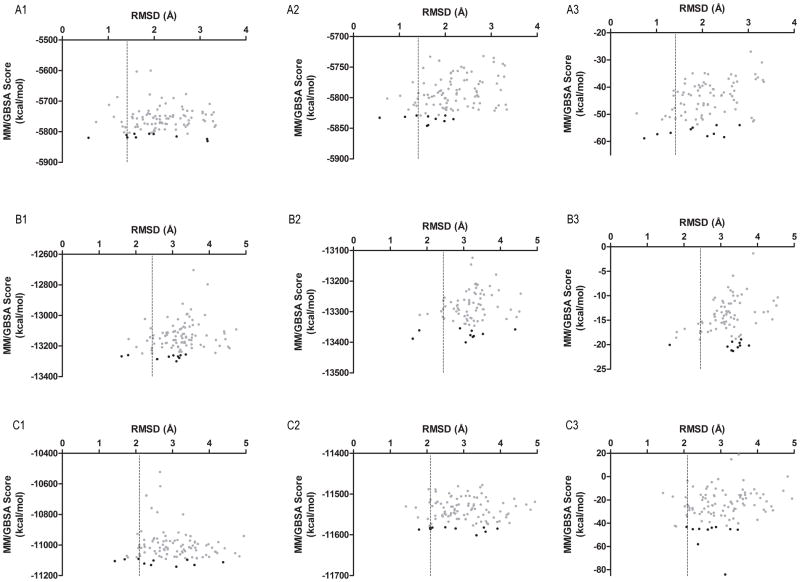
Figure 5.
RMSD versus MM/GBSA graphs of the top-100 predicted loop configurations (shown as grey dots) from GART (row A), CYP119 (row B), and enolase (row C). The single snapshot MM/GBSA score of the protein without bound ligand, the single snapshot MM/GBSA score of the protein with bound ligand, and the direct interaction between the protein and ligand (ΔGP-L) is shown in column 1, 2, and 3. The top-10 ranked predicted loop configurations are shown as black dots. The horizontal dashed line indicates the cutoff for the ten lowest RMSD predicted loop configurations. This figure caption will be rotated by 90 degrees to correspond to the above figure in order for the figure to fit on a single page.

