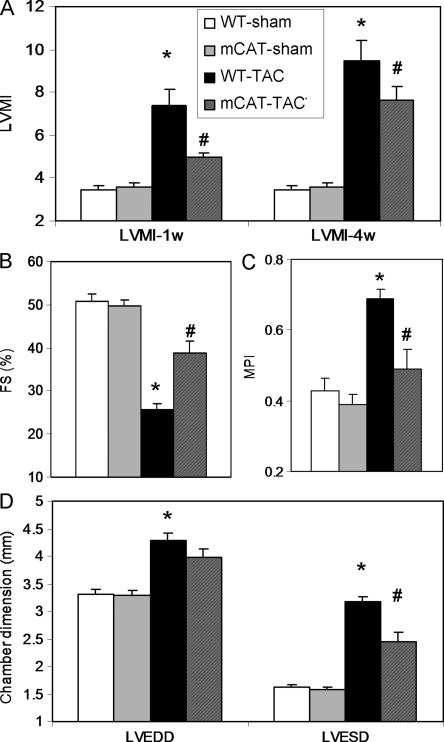
Figure 1.
Echocardiographic measurements of cardiac structure and function. (A) Left ventricular mass index (LVMI) at 1 week and 4 weeks after TAC displayed a progressive increase in WT-TAC that was attenuated in mCAT-TAC. (B) Systolic function measured by per cent fractional shortening (FS%) showed dramatic decline in WT-TAC at 4 weeks, which was ameliorated in mCAT-TAC. (C) Measurement of MPI showed a significant impairment (increase) in WT-TAC, which was better protected in mCAT-TAC. (D) Both left ventricular end-diastolic dimension (LVEDD) and end-systolic diameter (LVESD) were significantly greater after 4 weeks of TAC. *P< 0.05 for WT-sham vs. WT-TAC, #P< 0.05 for mCAT-TAC vs. WT-TAC.

