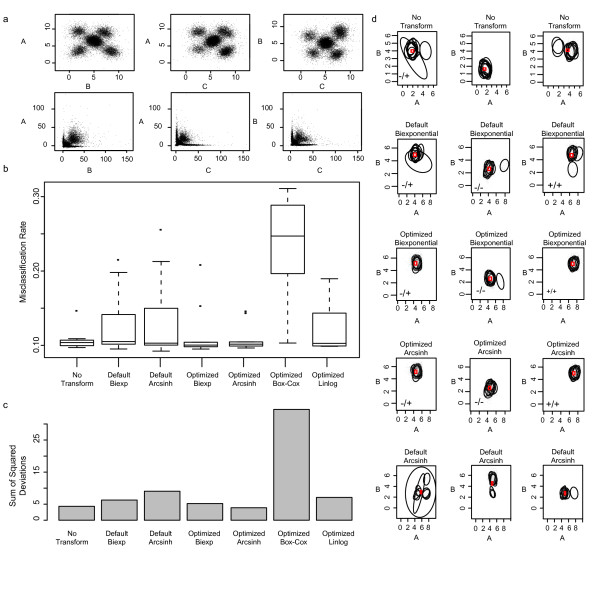
Figure 2.
Simulation study results. Results of transformations on simulated data. a) A single simulated sample is shown as a series of bivariate dot plot projections. Data are presented on the original scale (top row), and on the scale of the inverse biexponential transform (bottom row). Points represent individual events. b) Boxplots representing the distribution of misclassification rates of flowMerge models with K = 9 components fitted to the simulated data set under different transformations. c) Intra-cluster variability measured as the total sum of squared deviations for metaclustered populations identified by flowMerge under different transformations. d) Example bivariate projections of metaclusters for untransformed data (top row), default biexponential (second row), optimized biexponential (third row), optimized generalized arcsinh (fourth row), and default generalized arcsinh (fifth row). Corresponding metaclusters were selected where possible. Metaclusters are labeled as +/+, -/-, -/+ for artificial markers A and B. Ellipses represent 90th quantile contours of subpopulations.

