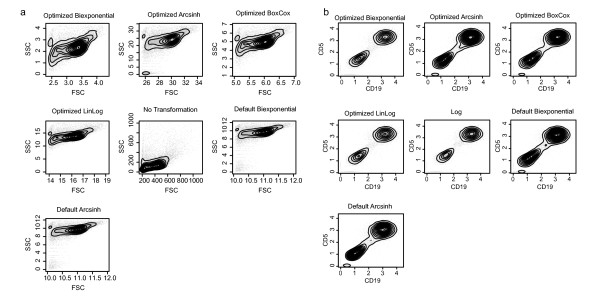
Figure 3.
Visualization of FCM data under different transformations. Visualization of flow cytometry data under different transformations. a) The FSC and SSC dimensions of a representative sample transformed using the biexponential, generalized arcsinh, generalized Box-Cox, and linlog transformations with optimized parameters. Untransformed and default-parameter generalized arcsinh and biexponential transformed data are shown for comparison. Some parameter-optimized trans-formations (biexponential and generalized Box-Cox in this example) improve visualization and resolution of the lymphocyte cell population when compared to default or untransformed data. b) Comparison of a fluorescence channel data under different parameter optimized and default transformations. In this example, the optimized biexponential and optimized linlog improve the resolution of the two populations in the CD19 vs CD5 channels, compared to the default generalized arcsinh or default biexponential. Points represent individual events, contours represent the two-dimensional kernel density estimate of the data.

