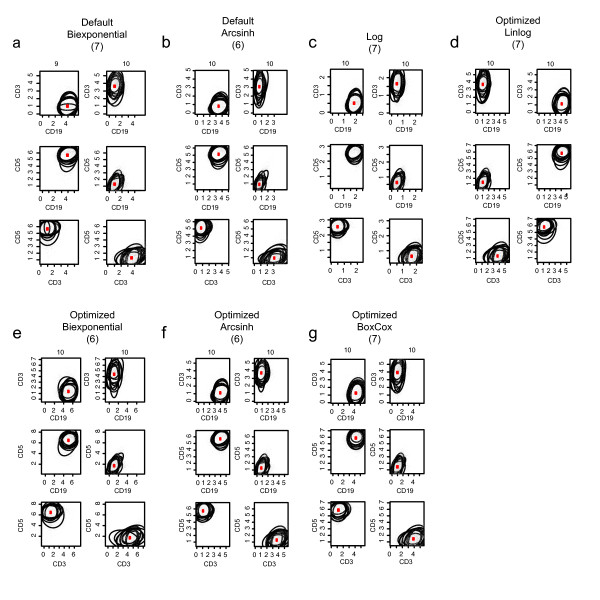
Figure 6.
Metaclusters in the fluorescence channels. Metaclusters of cell populations defined in the fluorescence channels of the lymphoma data under different transformations. Only the primary cell populations are shown for comparison (CD19+/CD3-/CD5+ and CD19-/CD3+/CD5-). The number of metaclusters for the transformed data is shown in brackets. The number of cell populations in a metacluster is shown above the plot. Contours represent the 90th percentiles of the cell subpopulation distributions.

