Figure 1.
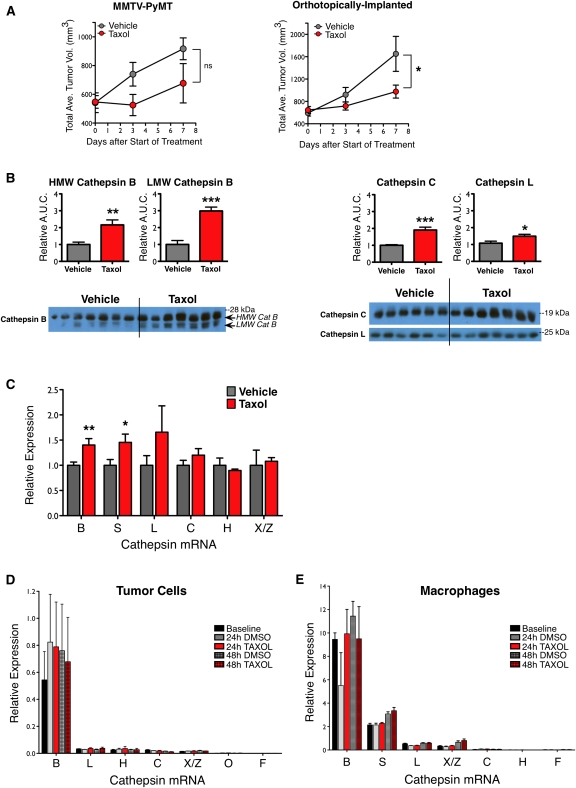
Cathepsin levels in mammary tumors increase following Taxol treatment. (A) Tumor volume curves for PyMT transgenic mice (left) and orthotopically implanted mice (right) treated with one dose of either vehicle or Taxol (50 mg/kg) on day 0, as described in the Materials and Methods. n = 16–17 for PyMT mice; n = 5–8 for orthotopic model of TS1 PyMT cell line; (*) P < 0.05; (ns) not significant. (B) Taxol increased cathepsin levels at the tumor site. Implanted tumors were harvested from mice 7 d after vehicle or Taxol treatment, and whole-tumor lysates were assayed for cathepsin proteins. Quantitation of high-molecular-weight (HMW) and lower-molecular-weight (LMW) active cathepsin B (left) and cathepsin C and cathepsin L (right) are shown above the corresponding Western blots. Quantitation of the loading control actin is in Supplemental Figure S2. n = 6–7 mice per group; (*) P < 0.05; (**) P < 0.01; (***) P < 0.0001. (C) Cathepsin transcripts also increased after Taxol treatment. qRT–PCR analysis for cathepsin genes in lysates from implanted tumors, relative to an endogenous control gene, Ubiquitin C, and normalized to vehicle. n = 7–8 mice per group; (*) P < 0.05, (**) P < 0.01 by the Mann-Whitney test. (D,E) qRT–PCR analysis of cathepsin transcripts in tumor cells (D) or macrophages (E) in culture following treatment with DMSO control or Taxol showed that expression does not change significantly. n = 3 independent experiments in each case.

