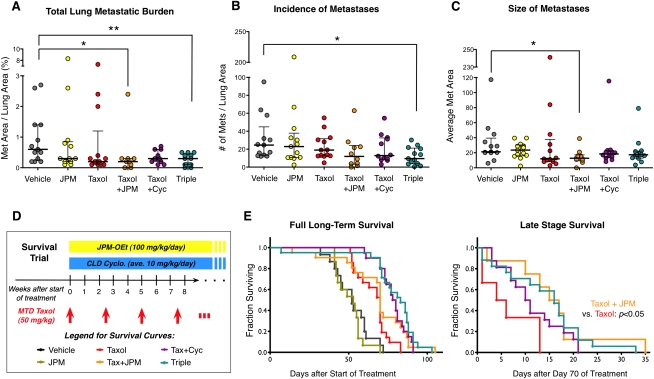
Figure 5.
Combination treatments reduce lung metastasis and increase survival. (A) Total lung metastasis burden for indicated treatment groups, as determined by the percentage of total lung area covered by metastases for each mouse. Each data point in the scatter plots represents the mean value for an individual animal; horizontal lines represent the median with the interquartile range. (*) P < 0.05, (**) P < 0.01, Mann-Whitney test; n = 13 vehicle, 13 JPM, 13 Taxol, 10 Taxol+JPM, 12 Taxol+Cyclo, 13 Triple. (B) Graph showing the number of metastases per mouse per unit area. (C) Graph showing the average size (area in square microns) of metastatic lesions. (D) Survival trial schematic showing dosing of MTD Taxol, JPM, and CLD Cyclo. (E, left) Kaplan-Meier long-term survival curves of mice in the treatment groups indicated. Late-stage survival data beginning at the 70th day of treatment with only mice alive on that day are shown at the right. n = 15–21 per treatment group. P-values from log-rank test comparisons of survival data can be found in Supplemental Table S4.

