Figure 3.
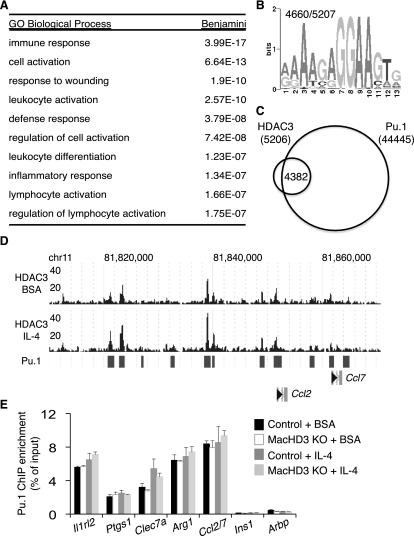
HDAC3 localizes to a subset of Pu.1-defined macrophage-specific enhancers. (A) Summary of GO categories enriched among genes nearest to HDAC3 regions in basal conditions (BSA). (B) Top most-enriched motif found in HDAC3-enriched regions upon de novo motif search; the number of times this motif was observed in all regions considered is reported in the top left. (C) Venn diagram demonstrating overlap of HDAC3 regions with published Pu.1 sites (Ghisletti et al. 2010). (D) Genome browser image of HDAC3-enriched sequence for part of chromosome 11 in BMDMs and the overlap of reported Pu.1 sites (bars). (E) Validation of Pu.1 binding at regions of HDAC3 enrichment by ChIP-qPCR. Regions were identified by nearest transcriptional start site (TSS). Regions at Ins1 and Arbp TSS served as controls (n = 3–5). Error bars, SEM.

