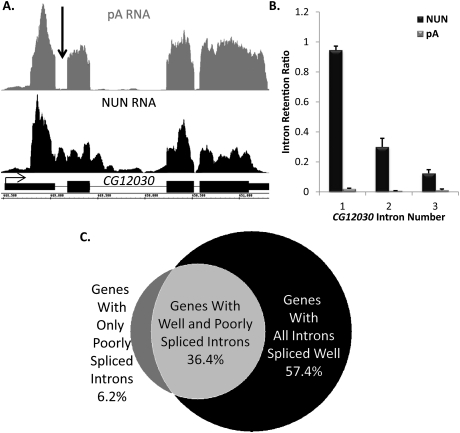
Figure 2.
Select introns are dramatically retained in the nascent transcript, while others in the same gene are efficiently spliced. (A) A gene, CG12030, that has an intron with high retention (arrow) in the NUN RNA sample (black) and no matching intron signal in the pA (gray) control sample. Gene structure is in black. (B) Quantification of intron retention for CG12030. (C) A Venn diagram demonstrating that poorly spliced introns are found in ∼43% of analyzed genes and coexist with introns undergoing efficient cotranscriptional splicing in 36% of cases.

