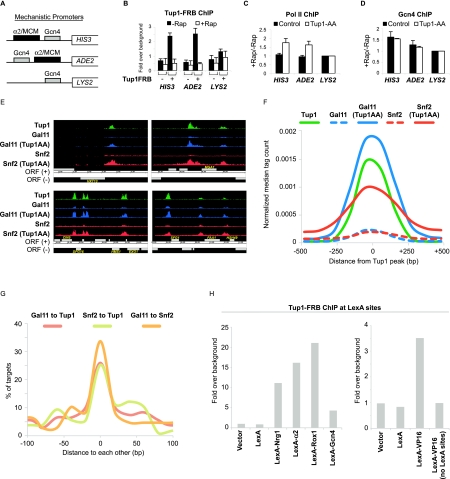
Figure 6.
Tup1 represses transcription by masking the activating potential of a diverse class of repressor–activator proteins. (A) Diagram illustrating the arrangement of binding sites (α2/MCM, which is bound by a Tup1-recruiting DNA-binding repressor complex, and Gcn4) at three artificial promoters fused to the HIS3, ADE2, and LYS2 genes. (B) Tup1 association with the indicated artificial promoters in the control and the Tup1-anchor-away strains that contain the mechanistic promoters shown in A before and after rapamycin treatment for 1 h. (C) Changes in Pol II association with the indicated artificial promoters in the control and the Tup1-anchor-away after rapamycin treatment for 1 h. (D) Changes in Gcn4 binding in the control and the Tup1-anchor-away that contain the mechanistic promoters.. (A–D) An ORF-free region of chromosome V was arbitrarily defined as background. Averages and standard errors of three individual experiments are shown. (E) Representative genome browser (Affymetrix Integrated Genome Browser) screenshots showing binding regions of Tup1, Snf2-HA, and Gal11-Myc in the presence or absence of Tup1 (after Tup1 depletion) around the indicated ORFs. (F) Binding profile of Tup1 (black line), Gal11-Myc (blue line), and Snf2-HA (red line) at Tup1-repressed promoters before (broken line) and after (solid line) Tup1 depletion (Tup1AA). (G) Distances between peak summits of Gal11 and Snf2 relative to Tup1 peak summits, and between Gal11 and Snf2 peak summits at all Tup1-repressed promoters. (H) Tup1 association with four integrated tandem LexA sites in strains expressing the indicated LexA derivatives.

