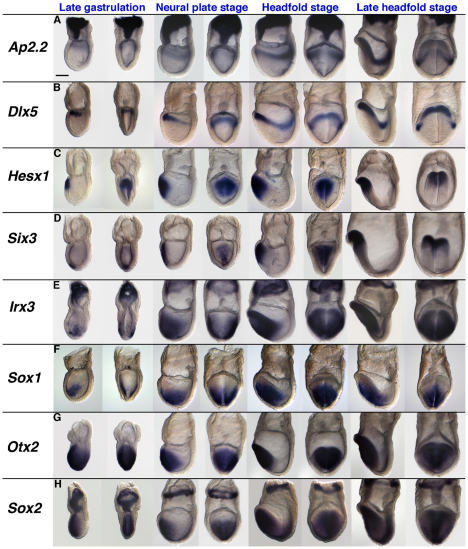
Fig. 4.
Temporal and spatial expression of anterior regional markers and lineage-specific markers from LS to late headfold (LHF) stages. The expression patterns of (A) AP-2.2 (Tfap2c), (B) Dlx5, (C) Hesx1, (D) Six3, (E) Irx3, (F) Sox1, (G) Otx2 and (H) Sox2 are shown on lateral and frontal views (left and right, respectively, of each pair). Note that Six3 is first detected in the axial mesendoderm and the adjacent ectoderm cells (D). Scale bar: 170 μm.

