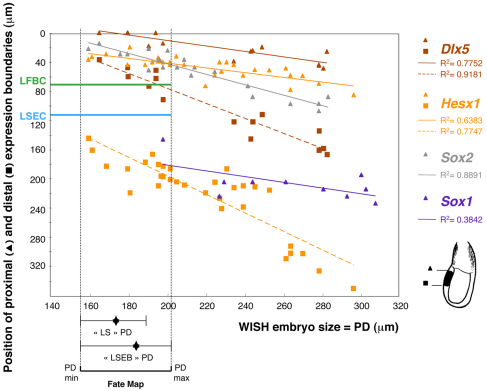
Fig. 5.
Relationship between gene expression patterns and the prospective fate map. The distance from the embryonic/extra-embryonic junction of the proximal (triangles) and distal (squares) expression boundaries of Dlx5 (n=15 embryos) and Hesx1 (n=32) plotted against embryo size as reflected by PD, for LS to LB stages (see Fig. 1A). The positions of the proximal expression boundaries of Sox2 (n=20) and Sox1 (n=10) are also shown. Note that Sox1 expression is absent in younger embryos (PD<200 μm). Each point represents an individual embryo. Colour-coded lines represent the linear regression of each point set. Correlation coefficients indicate a significant statistical relationship between the gene expression boundaries and embryonic size (P<0.001). The PD mean and range values of the fate map experiment (horizontal dashed lines) and the positions of LFBC and LSEC are indicated (green and blue lines). Together, they delimit an area that corresponds to the INT zone, which is composed of mixed fate progenitors. Values were adjusted for 5.6% shrinkage in PD in the WISH-treated embryos.

