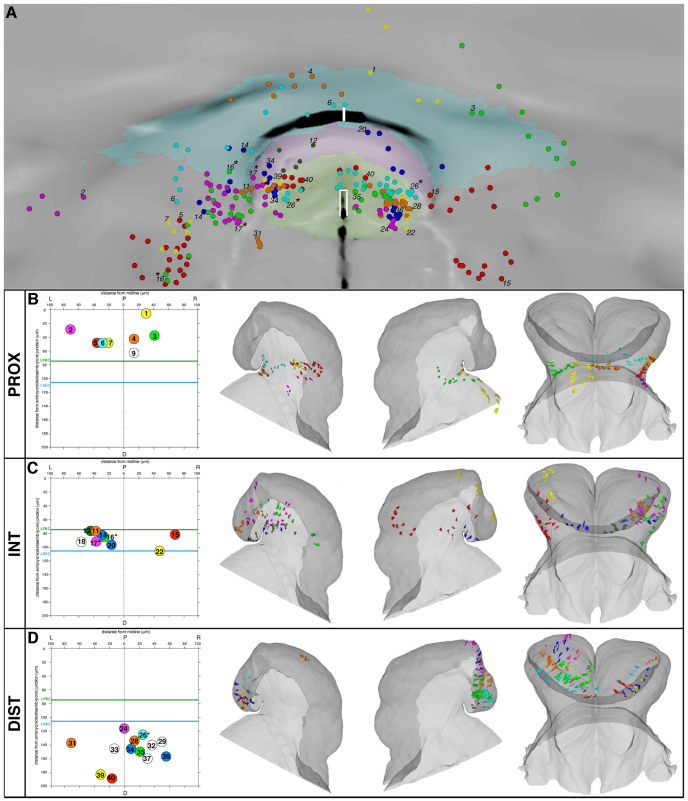
Fig. 8.
Two-dimensional flat map and representation of clone dispersion. (A) Distribution of the painted clones and anatomical domains represented in a 2D flat map (dorsal view). Part of the whole 2D flat map (see supplementary material Fig. S3 for the whole flat map) has been magnified here. Anterior is at the top. Anatomical domains are only shown for prospective forebrain (green), VEAP (purple) and buccal ectoderm (blue). Clone identification and position at the time of labelling and associated colour code after 24 hours of culture are as in Fig. 6B. The white open-ended rectangle represents the midline position of the foregut and the white bar represents the position of the oral plate. (B-D) Clone spatial dispersions based on the PROX, INT and DIST zones that have been distinguished by their clonal composition. Rows show the spatial position and colour code of the plotted progenitors and then left, right and frontal views of the 3D reconstruction. Asterisks indicate that one clone originated from two siblings.

