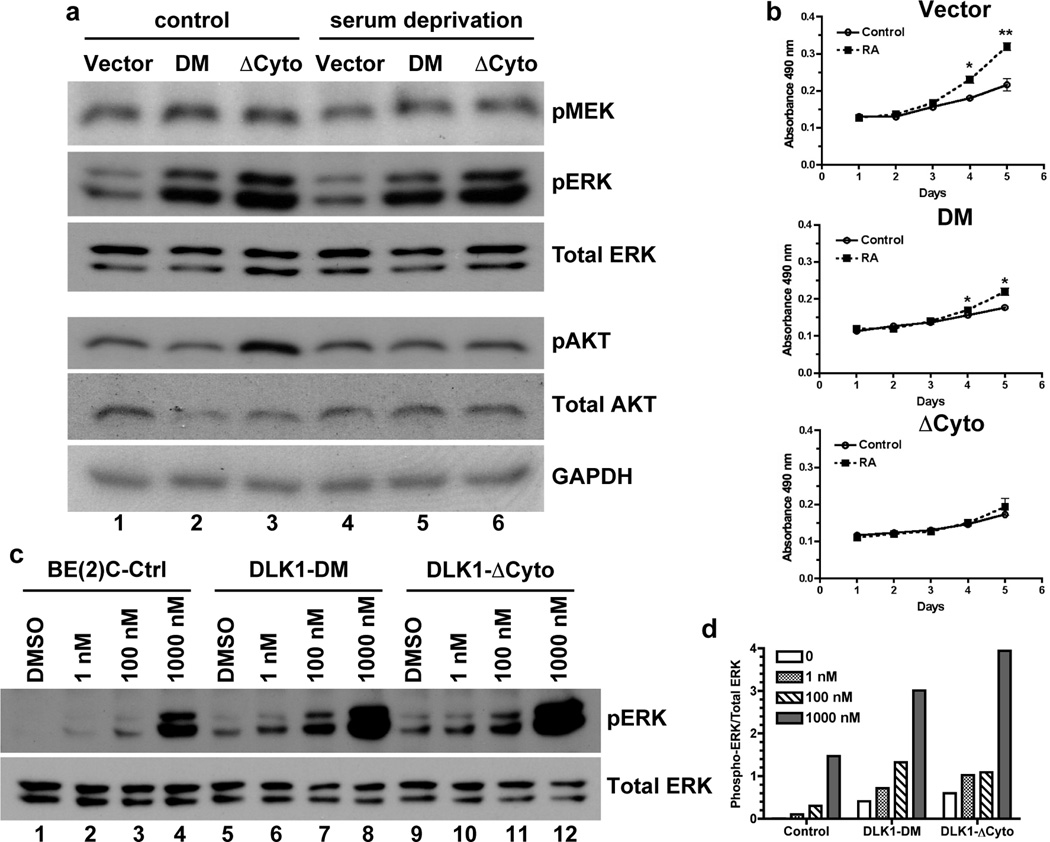
Figure 6. DLK1 loss-of-function increases ERK phosphorylation.
(a) Cell lysates were prepared from BE(2)C-Ctrl, DLK1-DM and DLK1-ΔCyto cells either under normal growth conditions (control) or after 16-hour serum deprivation. Phosphorylated and total proteins were examined using Western blots as described in Materials and Methods. One of three independent experiments is shown. (b) BE(2)C cells with stable expression of DLK1-DM, DLK1-ΔCyto or vector control were seeded at a density of 1 × 10⁴ cells per well in 96-well plates in the presence or absence of 1 nM retinoic acid (RA). Cell growth was analyzed by the MTS assay (Promega). Data shown are mean ± sem from three independent experiments. *p<0.02; **p<0.007 versus control at each time point. (c) BE(2)C cells with stable expression of DLK1-DM, DLK1-ΔCyto or vector control were incubated with 1nM, 100nM, 1µM RA for 48 hours. Phosphorylated and total ERK proteins were examined using Western blots. (d) Ratios of phophorylated to total p42 ERK protein were calculated using density measurements by NIH Image J. One of three experiments was shown.

