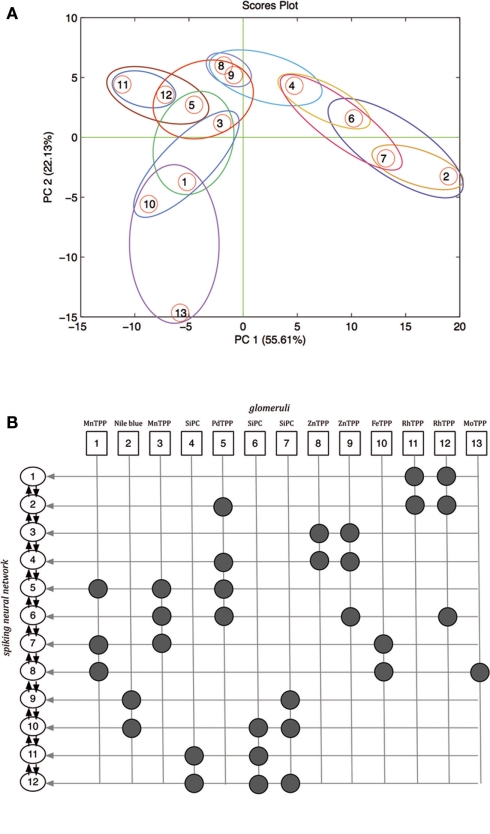
Figure 7.
(A) Scores plot of the first two principal components of the PCA of the matrix of the centroid fingerprints as defined by the application of the KNN to the fingerprints matrix. Closed regions show the membership of glomeruli to the network neurons. (B) Relationship between chemical indicators, glomeruli, and neural network neurons excitatory inputs. Glomeruli signals contribute as excitatory inputs to the spiking neural network neurons. The arrows between the network neurons indicate the inhibitory signals.

