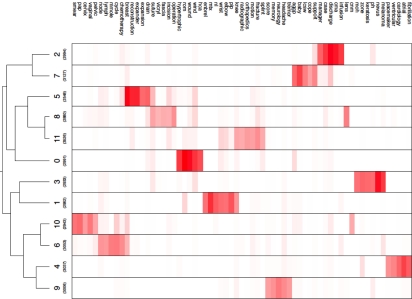
Figure 1.
Visualization of the hierarchical cluster tree demonstrating how clusters are related to each other by showing a color-intensity plot of the various values in the cluster centroid vectors. The height of each row is proportional to the log of the corresponding cluster’s size. The columns correspond to the union of the 5 descriptive and discriminating features of each cluster.

