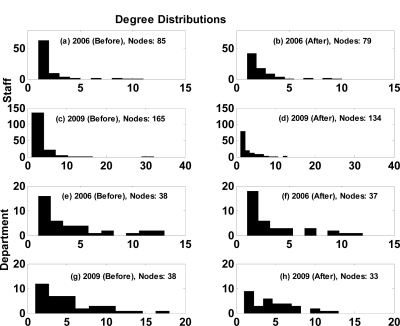
Figure 2.
The degree centrality distribution of the dominant clusters before (Before) and after (After) perturbing the most influential node (i.e. node with the highest degree) across hierarchically related scales Staff (a–d) and Department (e–h), and across time (2006, 2009). The axes in each row are represented on the same scale to enable direct comparison.

