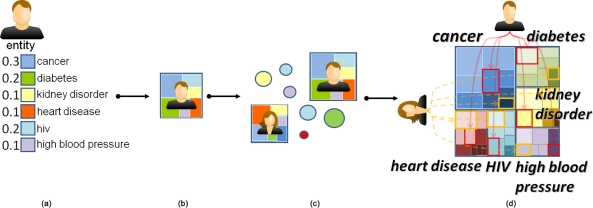
Figure 3:
DICON uses an icon design that encodes (a) a feature vector for each patient as (b) a series of color coded regions. This process is (c) repeated for all patients and (d) clusters are represented as interleaved hierarchical arrangements of the color-coded regions. The overall icon conveys the underlying prominence of each dimension of the feature vector across the cluster through the total area allocated to each color.

