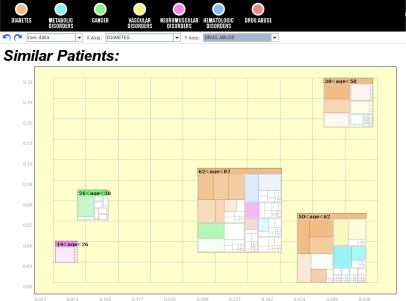
Figure 6:
Icons can be embedded within other visualizations such as scatter plots. This screenshot shows that diabetes (x-axis) becomes common in older patients. Meanwhile, drug abuse (y-axis) is most frequent within only the 38–50 age bracket although that cluster’s icon shows that diabetes is still a much larger concern.

